Head and Shoulders
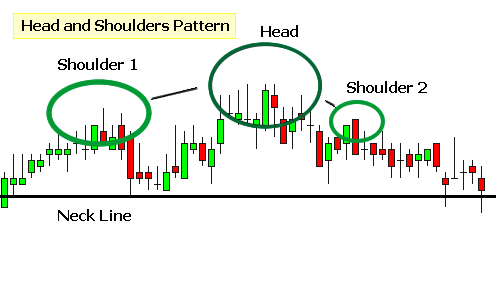
The Head and Shoulders pattern is classified as a reversal formation. The Head and Shoulder pattern can be seen in a chart when it has formed a peak (first shoulder), followed by a higher peak (the head) and a final lower peak (second shoulder). After identifying the head and shoulders, we can then draw what is referred to as the neckline. The neckline is a line that connects the beginning of the first shoulder and the end of the second shoulder. Any break below the neckline is a bearish signal and usually results in a continued fall in price.

Applying the Head and Shoulders Pattern
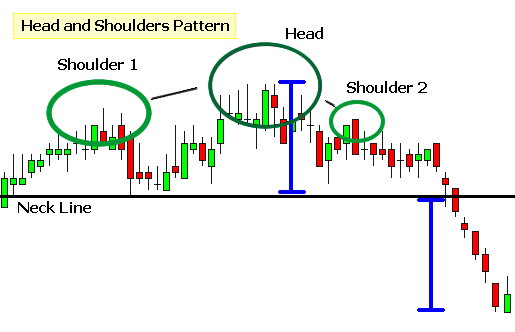
When planning a trade to take advantage of a neckline break, we use the existing Head and Shoulderpattern to estimate how far the stock price may fall. To do this estimation, first find the height of the “head” above the “neckline” and then using that height measurement, apply it from the neckline-break and measure down. The chart below shows an example of this.
