Bollinger Bands

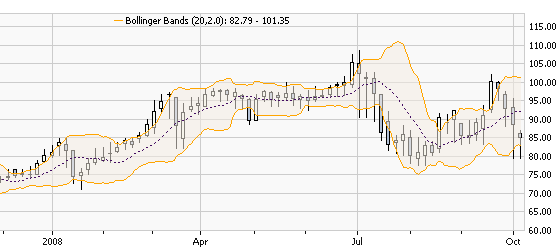
Bollinger Bands ® help you to evaluate a stock’s volatility over time. When plotting Bollinger Bands ® on a chart will see one line above and one line below the price chart of the stock. When a stock is making major price movements or is very volatile its Bollinger Bands ® will be farther away (expand) from the stock’s price chart. When a stock is moving steadily with minor price movements, the Bollinger Bands ® will be closer to (contract upon) the stock’s price chart.
Bollinger Bounce
A common technical use of Bollinger Bands ® is to predict when a stock’s price will “bounce” off the top or bottom Bollinger line and then return back towards the center of the Bollinger Bands ®. Therefore, giving a bullish indicator to a stock whose price is close to or touching the bottom Bollinger Band and a bearish indicator to a stock whose price is close to or touching the top Bollinger Band.

Bollinger bands are intended to illustrate a stock’s current support and resistance levels. This means a low price the stock does well stays above (support) and a high price the stock has difficulty breaking past (resistance).
Bollinger Squeeze
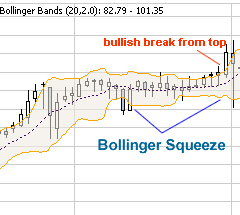
Another common technique used to predict trends with Bollinger Bands ® is called the Bollinger squeeze. When the bands contract so much that they begin to appear to “squeeze” the stock’s price chart, is when the Bollinger squeeze occurs. This is usually a a pending breakout which could be bullish or bearish. Should the stock’s price begin to break above the top Bollinger Band it is a bullish sign that the stock with continue an upward trend. If the stock’s price breaks through the lower band, it is a bearish sign that the downward trend will most likely continue.

There are other techniques to determine trends with Bollinger Bands ®. However, the Bollinger Bounce and the Bollinger Squeeze are the most commonly used, and now you know how to use them. Congrats!