Reverse Head and Shoulders Pattern
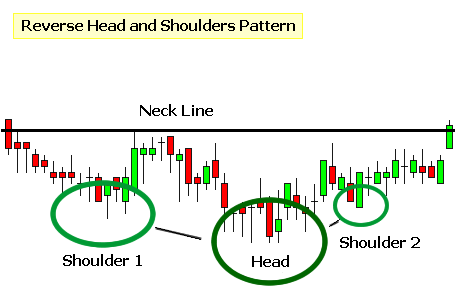
Also called an Inverse Head and Shoulders Pattern. This is a mirrored version on the standard Head and Shoulders pattern, the Reverse Head and Shoulders pattern is formed with an initial valley (first shoulder), followed by a lower valley (the head) and finally a higher valley (second shoulder). The Reverse Head and Shoulders pattern occurs after a downward trend has occurred in the stock.

The above example shows an example of a Reverse Head and Shoulders pattern. When using this pattern to our investment planning, we would set a trigger price to enter at just above the neckline. The neckline is the line draw from the beginning of the first “shoulder” to the second “shoulder.” Any break above the neckline is a bullish sign of a possible price recovery.
Applying the Reverse Head and Shoulders Pattern
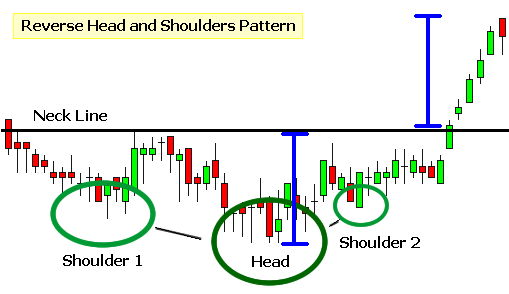
When planning a trade to take advantage of a neckline break, we use the existing Reverse Head and Shoulder pattern to estimate how far the stock price may climb. To do this estimation, first find the height of the “head” below the “neckline” and then using that height measurement, apply it from the neckline-break and measure up. The chart below shows an example of this.
